Crypto markets move fast and often feel chaotic — but indicators help cut through the noise. Whether you’re analysing Bitcoin, Ethereum or a smaller altcoin, the right indicators can help you avoid emotional decisions, identify opportunities earlier, and build a more objective trading strategy.
This guide explains what crypto indicators are, how they work, the most commonly used types, and how to combine them effectively. It is designed for beginners and early‑intermediate traders looking for practical, actionable insights.
Crypto Indicators Explained
Crypto indicators are mathematical calculations applied to price, volume, or market data to help traders interpret what’s happening on a chart. They don’t predict the future, but they provide structure and consistency so traders can evaluate trends, confirm momentum, and anticipate potential reversals.
Why crypto indicators matter
- They reduce emotional trading by offering data‑driven signals.
- They help identify trends early and avoid chasing price.
- They show when markets are strengthening or weakening.
- They reveal volatility spikes that often precede big moves.
- They allow traders to compare multiple assets objectively.
Indicators don’t replace strategy — they support it. The best traders use them as a compass rather than a crystal ball.
What Are the Main Categories of Crypto Indicators?
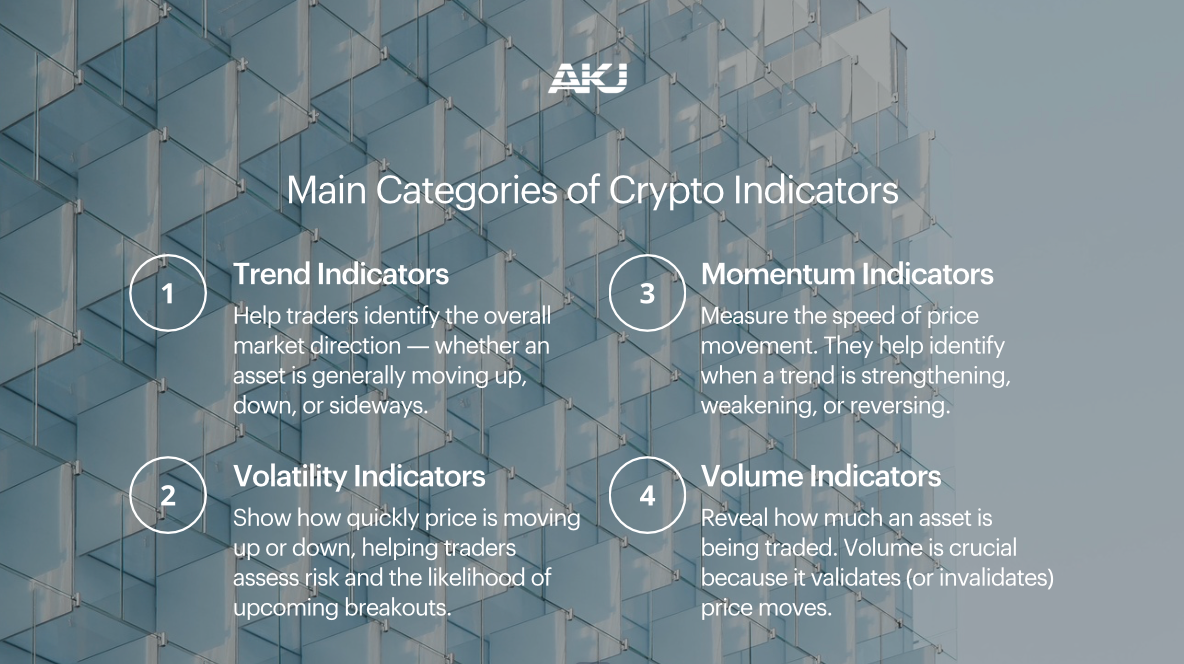
Most crypto indicators fall into one of four categories: trend, momentum, volatility, and volume tools. Understanding the category helps clarify what the indicator is actually telling you.
1. Trend Indicators
Trend indicators help traders identify the overall market direction — whether an asset is generally moving up, down, or sideways. Trending markets often behave differently from ranging markets, so knowing the trend is essential.
- Moving Averages (MA, EMA)
- Moving Average Envelopes
- Ichimoku Cloud
- Parabolic SAR
Useful for:
- Spotting the general direction and filtering out market “noise”.
Limitations:
- Sideways markets — they can produce many false signals.
2. Momentum Indicators
Momentum indicators measure the speed of price movement. They help identify when a trend is strengthening, weakening, or potentially reversing.
- RSI (Relative Strength Index)
- MACD (Moving Average Convergence Divergence)
- Stochastic Oscillator
Useful for:
- Timing entries during a trend or spotting overbought/oversold conditions.
Limitations:
- Momentum can stay high or low for long periods in strong trends.
3. Volatility Indicators
Volatility indicators show how quickly price is moving up or down, helping traders assess risk and the likelihood of upcoming breakouts.
- Bollinger Bands
- ATR (Average True Range)
- Keltner Channels
Useful for:
- Identifying breakout potential, contraction zones, and price extremes.
Limitations:
- They don’t show trend direction — only the intensity of market movement.
4. Volume Indicators
Volume indicators reveal how much an asset is being traded. Volume is crucial because it validates (or invalidates) price moves.
- On-Balance Volume (OBV)
- Volume Profile
- Chaikin Money Flow (CMF)
Useful for:
- Confirming breakouts, identifying accumulation/distribution, validating trends.
Limitations:
- Crypto volume varies by exchange, which can distort readings.
What Are the Main Types of Crypto Indicators?
Now let’s look at the most widely used and beginner‑friendly indicators individually.
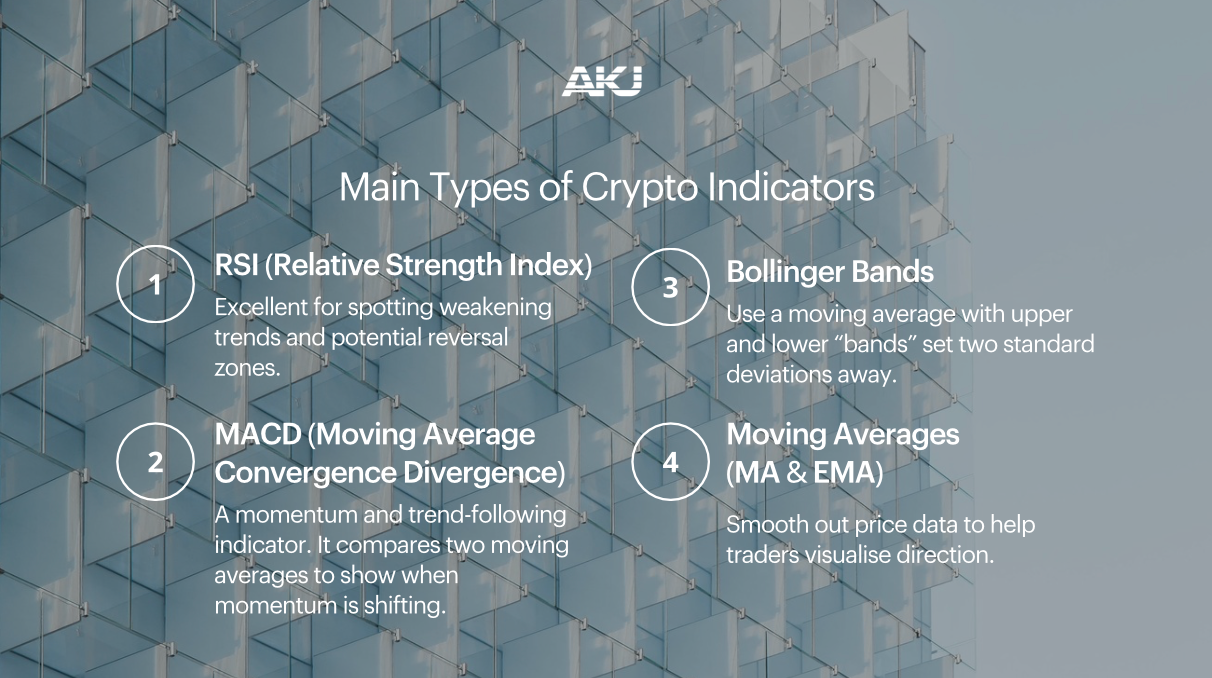
RSI (Relative Strength Index)
RSI measures momentum on a scale of 0–100.
- Above 70 → potentially overbought
- Below 30 → potentially oversold
- Between 40–60 → neutral zone
Why traders use it:
- RSI is excellent for spotting weakening trends and potential reversal zones.
What to watch for:
- RSI can stay overbought or oversold for extended periods in strong bull or bear markets.
MACD (Moving Average Convergence Divergence)
MACD is a momentum and trend‑following indicator. It compares two moving averages to show when momentum is shifting.
Key signals include:
- MACD line crossing the signal line (bullish/bearish shift)
- MACD crossing above or below zero (trend confirmation)
- Divergences between MACD and price (possible reversals)
MACD is especially popular because it shows both trend and momentum in one tool.
Bollinger Bands
Bollinger Bands use a moving average with upper and lower “bands” set two standard deviations away.
They help traders see:
- When volatility is expanding
- When price is unusually high or low
- When a breakout may be approaching
A classic pattern:
“Tight bands” often come before big breakouts — known as the Bollinger Squeeze.
Moving Averages (MA & EMA)
Moving Averages smooth out price data to help traders visualise direction.
Types:
- SMA (Simple Moving Average)
- EMA (Exponential Moving Average)
Common uses:
- Identifying trend direction
- Spotting dynamic support/resistance
- Crossovers (e.g., the “Golden Cross”)
Limitations:
- They lag behind price — which leads us to the next section.
What Is the Difference Between Leading and Lagging Indicators?
Understanding this distinction is key to using indicators effectively.
Leading Indicators
Leading indicators attempt to signal potential future price movements before they happen.
Examples:
- RSI
- Stochastic Oscillator
- Fibonacci levels
- Some volatility tools
Strengths:
- Good for early entries
- Useful in ranging markets
Weaknesses:
- Higher chance of false signals
- Less reliable in strong trends
Lagging Indicators
Lagging indicators confirm trends after they have begun.
Examples:
- Moving Averages
- MACD
- Ichimoku Cloud
Strengths:
- More reliable
- Work well in trending markets
Weaknesses:
- Provide slower signals
- Can lead to late entries during strong moves
In practice:
Most traders use a combination of both to balance early warnings with confirmation.
How to Combine Crypto Indicators Effectively
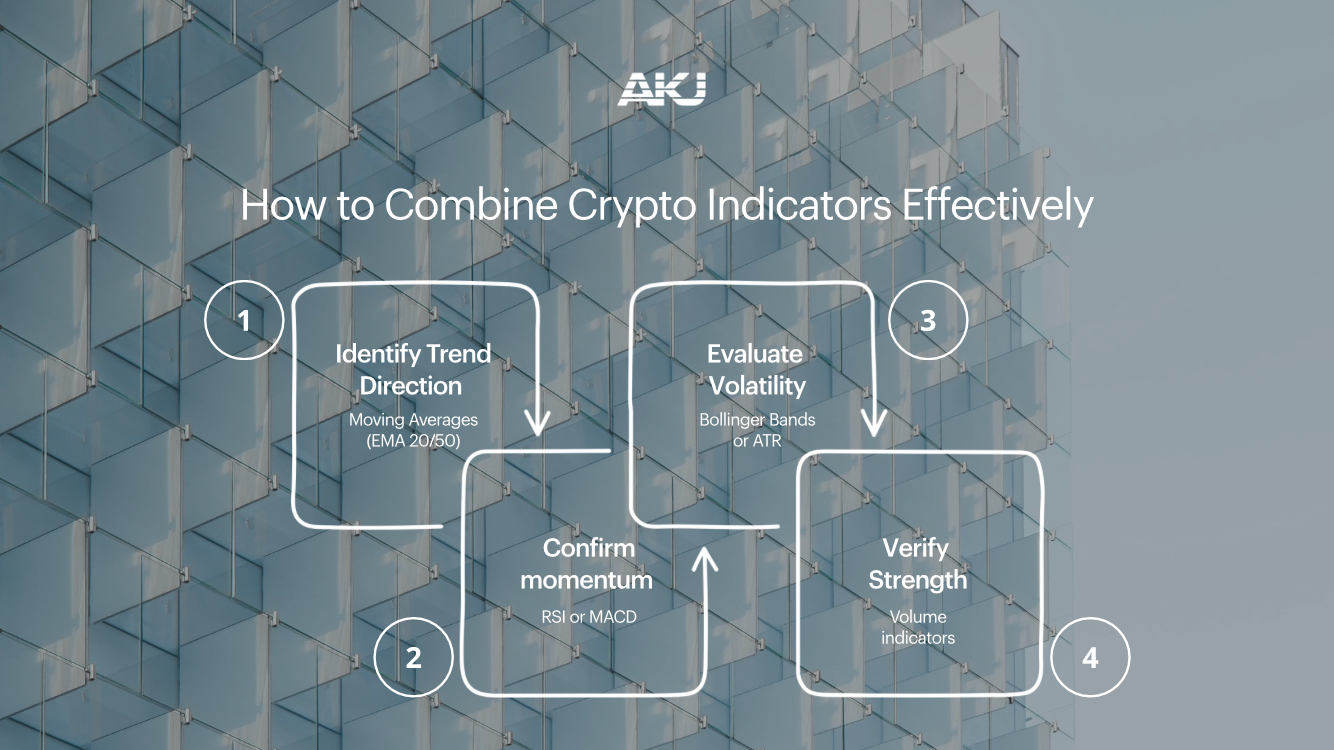
Using multiple indicators isn’t about stacking as many as possible. It’s about combining complementary tools that confirm each other.
A simple, effective combination strategy:
1. Identify trend direction → Moving Averages (EMA 20/50)
If EMA20 > EMA50 → trend is bullish.
If EMA20 < EMA50 → trend is bearish.
2. Confirm momentum → RSI or MACD
Use RSI to check whether the trend is overextended.
Use MACD to confirm whether momentum supports the trend.
3. Evaluate volatility → Bollinger Bands or ATR
Narrow bands = consolidation
Wide bands = high volatility (breakout risk)
4. Verify strength → Volume indicators
Breakouts with strong volume are more reliable.
Example of a working combo
- EMA 20/50 (trend)
- RSI (momentum)
- Bollinger Bands (volatility)
- OBV (volume)
This 4‑indicator stack is used by many intermediate traders because it’s:
- Easy to read
- Good for both trending and ranging environments
- Provides clear entry/exit signals
Short Recap / Summary
Crypto indicators don’t tell the future — but they help traders structure decisions and reduce uncertainty. The best crypto indicators fall into four categories: trend, momentum, volatility, and volume tools.
- Trend indicators show the direction of the market.
- Momentum indicators show whether a move is accelerating or slowing down.
- Volatility indicators highlight risk and breakout potential.
- Volume indicators confirm whether price action is genuine.
- Leading indicators offer early signals, while lagging indicators provide confirmation.
- Combining 2–4 complementary indicators is more effective than using many at once.
Used correctly, indicators help traders avoid emotional decisions, spot opportunities, and strengthen their overall strategy.
Ready to Learn More?
- Contact us to explore how AKJ can support your digital asset strategy.
- Learn more about our institutional‑grade digital asset solutions.
- Read more on our blog for expert insights into crypto markets.